GPU Monitoring on Windows 10 for Machine Learning & CUDA

Introduction
I recently installed a brand new RTX 2080 TI GPU in order to speed up the training process when running machine learning scripts.
I could not see the GPU usage go above 5% which just didn't make sense. To someone new, it was not so obvious why. The assumption I made was that that windows task manager would simply show the overall GPU usage.
After some thought I did notice the GPU memory usage was quite high, so it must be doing a lot of work, then I realised the metric I was after was ‘CUDA’ performance which simply does not show by default and is not an included metric in the main processes table in task manager.
What the default view looks like
The default view in the ‘Performance’ tab does not show much action, however, I am maxing out the GPU, specifically using CUDA. Note, you can see that the GPU memory is quite high 8.4GB/11GB.

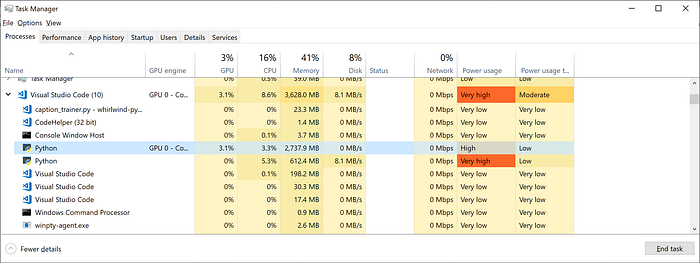
Looking back at the main processes view the column which says ‘GPU’ only shows 3%. I would have at least expected this column to include all the metrics of work happening inside the graphics card. Even this just does not show work from CUDA.

Add CUDA monitoring
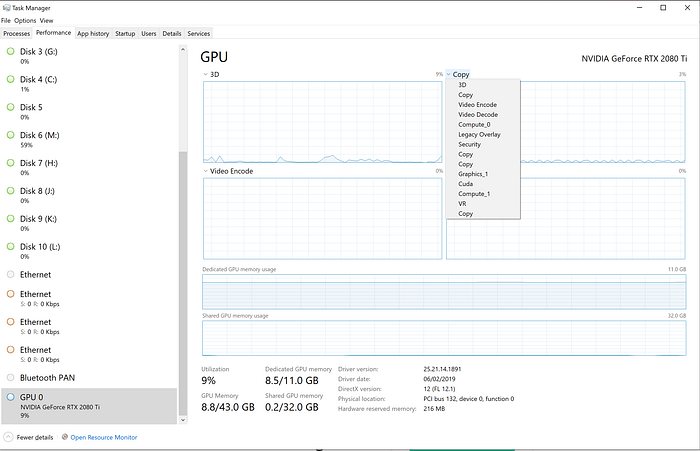
So if we switch back to the ‘Performance’ tab and pick one of the graphs and right click on the drop down we see a list of other performance metrics.
Let's replace the ‘Copy’ graph with ‘CUDA’

Excellent, now I get confirmation of where the action is happening. Currently, you can see the GPU — Cuda is working at around 70%

